Jay Dickson
jdickson@umn.edu
RESEARCH |
Polar Science |
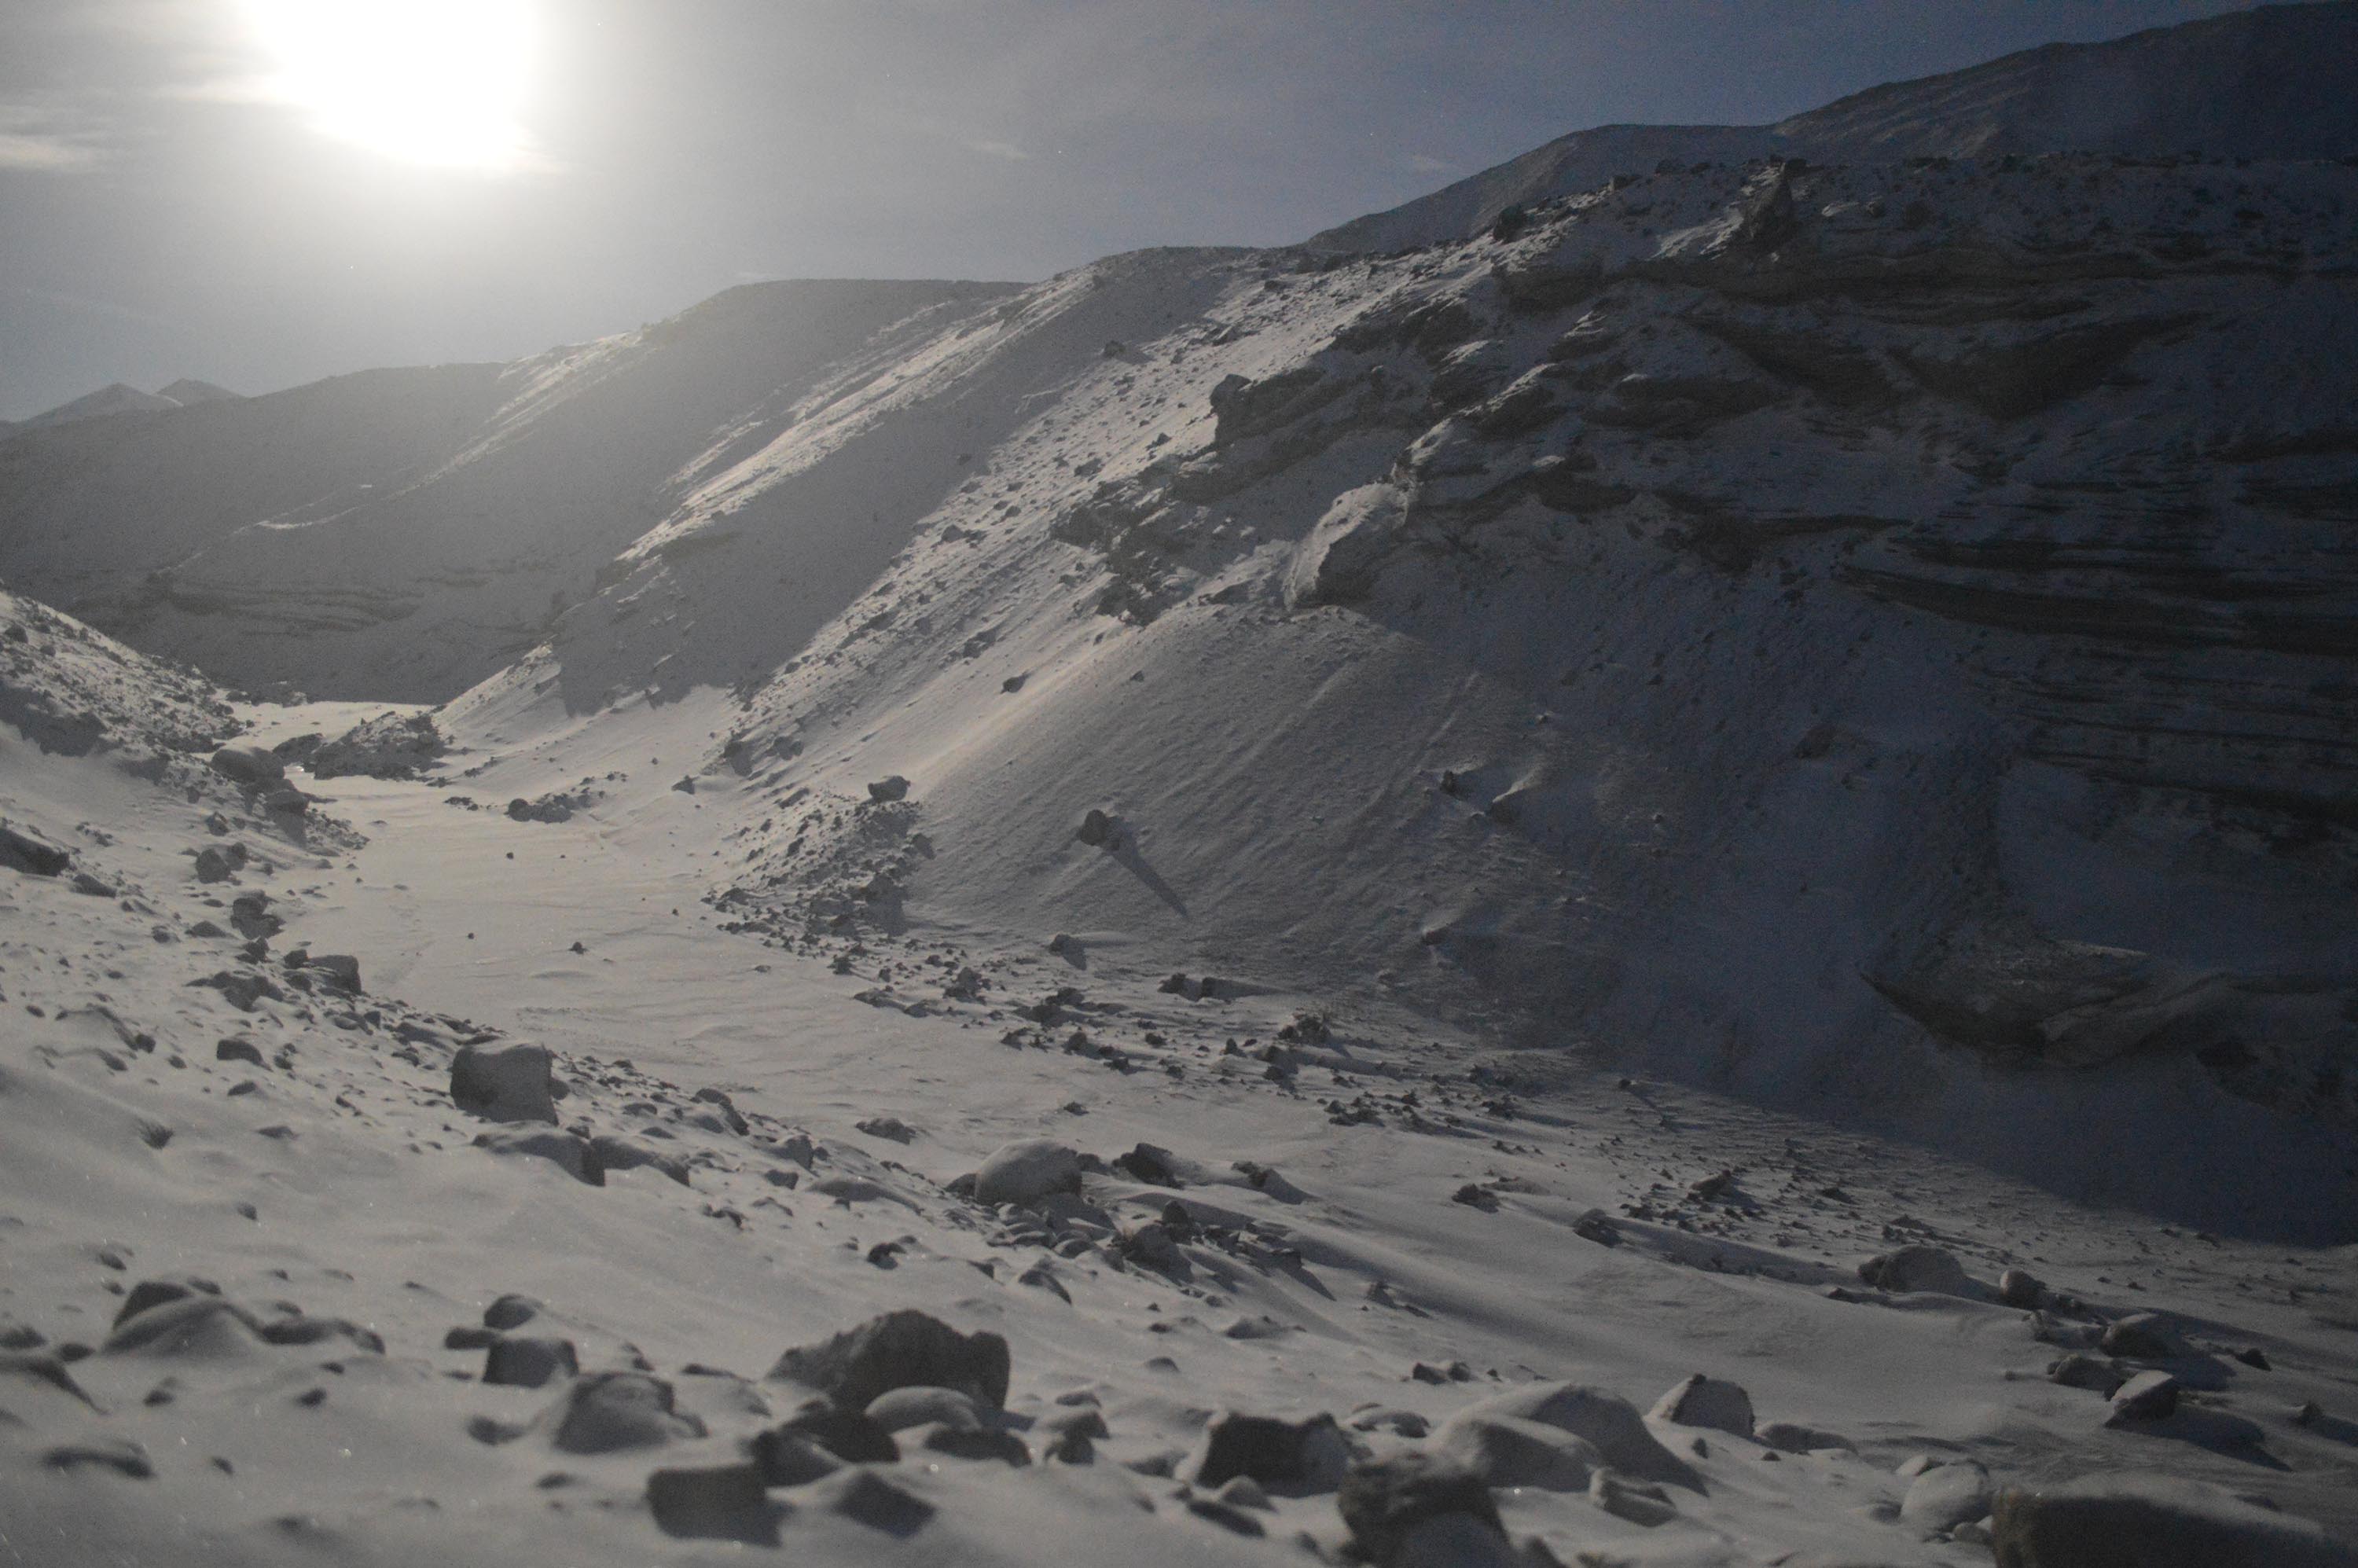
The Earth's poles provide the most direct record of recent climate change and also are where massive ice reservoirs are vulnerable to melting. I conduct research at both poles to determine how polar surfaces are changing on annual and decadal timescales. I integrate these field data with orbital observations to develop thorough reconstructions of polar surface evolution. * * * Absorption of atmospheric water by salts on the ground (deliquescence) is one way that the polar desert of Antarctica is capable of making small amounts of liquid brine. This process is extremely difficult to document but we used long-duration (several months) high-frequency (every 5 minutes) time-lapse photography combined with in-situ measurements of relative humidity to fully describe how this process behaves on a daily cycle. As observed in the video above in Garwood Valley in the McMurdo Dry Valleys, bright salts are observed in daytime but turn dark when they generate brines in the evening when the valley falls under shadow and the relative humidity rises. * * * The McMurdo Dry Valleys of Antarctica receive less than 10 cm of percipitation per year, and most of that is in the form of snow that sublimates rapidly. Yet stream channels still form from meltwater on an annual basis. How is this possible? In some areas, massive glaciers provide a perennial source of ice to melt, but what about regions without perennial water sources? * * * Time-lapse imaging during austral winter allows for unique observations of how the surface of Antarctica changes when field work is not possible. Our cameras have worked through the frigid Antarctic winter and captured light reflected off of the gibbous Moon, allowing for the assessment of surface snow deposits and lake-level measurements of Don Juan Pond.
* * * The McMurdo Dry Valleys, Antarctica, provide the most pristine landscape on Earth to investigate how small changes in climate result in landscape change. This surface response has been historically challenging to document in the Dry Valleys due to extremely low rates of change, which are typically too low to be perceptible with traditional field observations. Time-lapse imaging reveals this surface response at unprecedented spatial and temporal resolution. Cameras record images every 5-minutes for several months during peak austral summer, when conditions at the surface briefly surpass the triple point of H2O. These images are synchronized with meteorological data to close the climate forcing/surface response loop, and allow for the testing of detailed hypotheses regarding Antarctic landscape evolution. See summary as reported in Dickson et al., 2014. * * *
Brine generation in Don Juan basin, Antarctica. Time-lapse data show water tracks hydrating at the exact moment that a front of moist air passes through Upper Wright Valley. This is confirmation that salts (specifically CaCl2) absorb water out of the atmosphere, generating brines that match the composition of Don Juan Pond, the saltiest body of water in the world. From Dickson et al., 2013. * * *
Discharge into Don Juan Pond, Antarctica. Two months of 5-minute interval imaging allowed for detailed mapping of inputs into Don Juan Pond. Freshwater is input from the west (right), while previously undocumented seeps of brine provide input from the east (left). These pulses are controlled by diurnal spikes in surface temperature, consistent with a near-surface source. Input from deep groundwater sources was not observed. From Dickson et al., 2013.
* * *
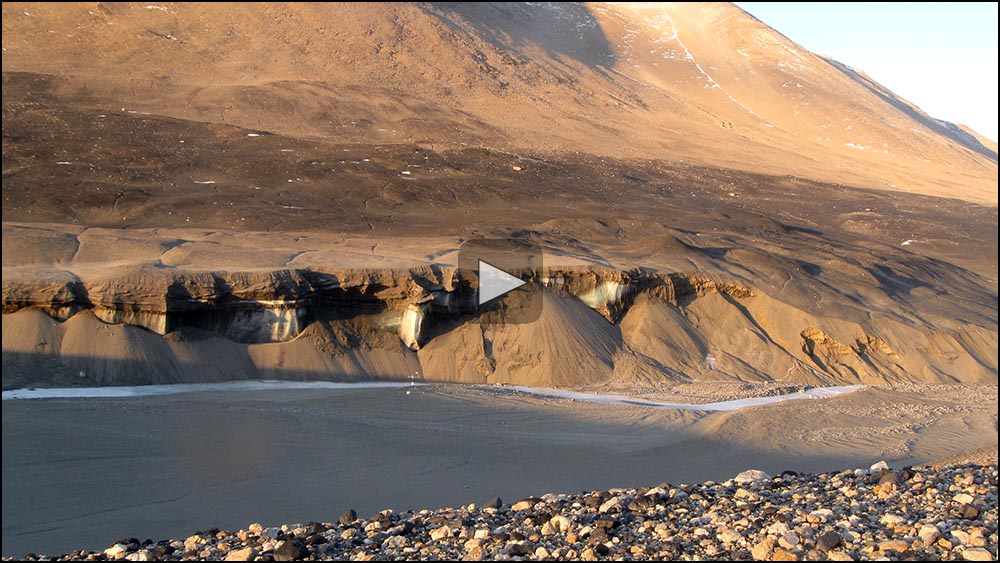
Melting of the Garwood Ice Cliff, Antarctica. A stranded ice mass is exposed on its equator-facing side. Time-lapse imaging has shown that its rapid recession (~1 m/yr) is due to direct radiation, as opposed to undercutting by the Garwood River. From Levy et al., 2013.
I am currently part of a large NSF-funded project that monitors river bank erosion in arctic Alaska in an effort to aid native communities who are at risk from increased melting. I lead the design and construction of time-lapse monitoring stations that document this process in high spatial and temporal resolution, and I wrote the software to correlate surface activity with met station data to determine the climatic force responsible. This is brand new research that will be continued through 2026. 
|